Ruin Detection from Orbit
A multimodal pipeline that flags archaeological anomalies in 30 m satellite DEMs, calibrated against seven famous sites.
- Calibration sites
- 7 famous · 1 cleanly detected
- DEM
- Copernicus DSM · 30 m/px
- Stage 2
- Multimodal VLM (Ollama)
- Output
- GeoJSON · SQLite · PNG
Premise
The Amazon basin keeps yielding pre-Columbian cities under the canopy every time a new lidar dataset gets released. The premise of this project: if a multimodal model can read terrain-derivative visualizations (hillshade, slope, local relief, sky-view factor, SAR) the way a remote-sensing archaeologist does, it might be able to flag anomalies at scale across open satellite data — without needing the lidar that researchers don't get to fly everywhere.
The pipeline runs every patch of a region through a stage-1 statistical filter (geometric regularity, linear-feature density, SVF anomaly, rectangularity) and forwards only the passing patches to a stage-2 vision-language model that writes a structured assessment. The honest test was: point it at seven of the most famous archaeological sites in the world and see what it does.
Calibration: seven famous sites as ground truth
- Calibration sites tested
- 7
- Cleanly detected
- 1of 7
- Anomalies identified
- 12
- Pipeline runs
- 7
The calibration sites span every era and continent that matters for the test: Angkor's 12th-century moats and causeways; the pyramids of Teotihuacan; the karst-buried Maya capital at Calakmul; Cahokia's earthen mounds in Illinois; Persepolis's terraced stone platforms in Iran; the Caral-Supe ceremonial centers in Peru; and the recently- lidared Upano Valley urban network in Ecuador.
Below: each calibration site, its detection result, and (where the model found them) the actual anomalies it flagged with multimodal analysis and supporting geometric statistics. Click any row to expand.
Angkor Wat
Cambodia · 12th-century Khmer temple complex, sprawling moats and causeways. Largest religious monument in the world by land area.
Detected2 anomalies·top 95%
Angkor Wat
Cambodia · 12th-century Khmer temple complex, sprawling moats and causeways. Largest religious monument in the world by land area.
- Coordinates
- 13.412°N, 103.867°E
- Stage-1 score
- 0.441
- Threshold
- 0.397
- Processing
- 52.5 s
archaeological earthworks
VLM confidence 95%·false-positive risk low
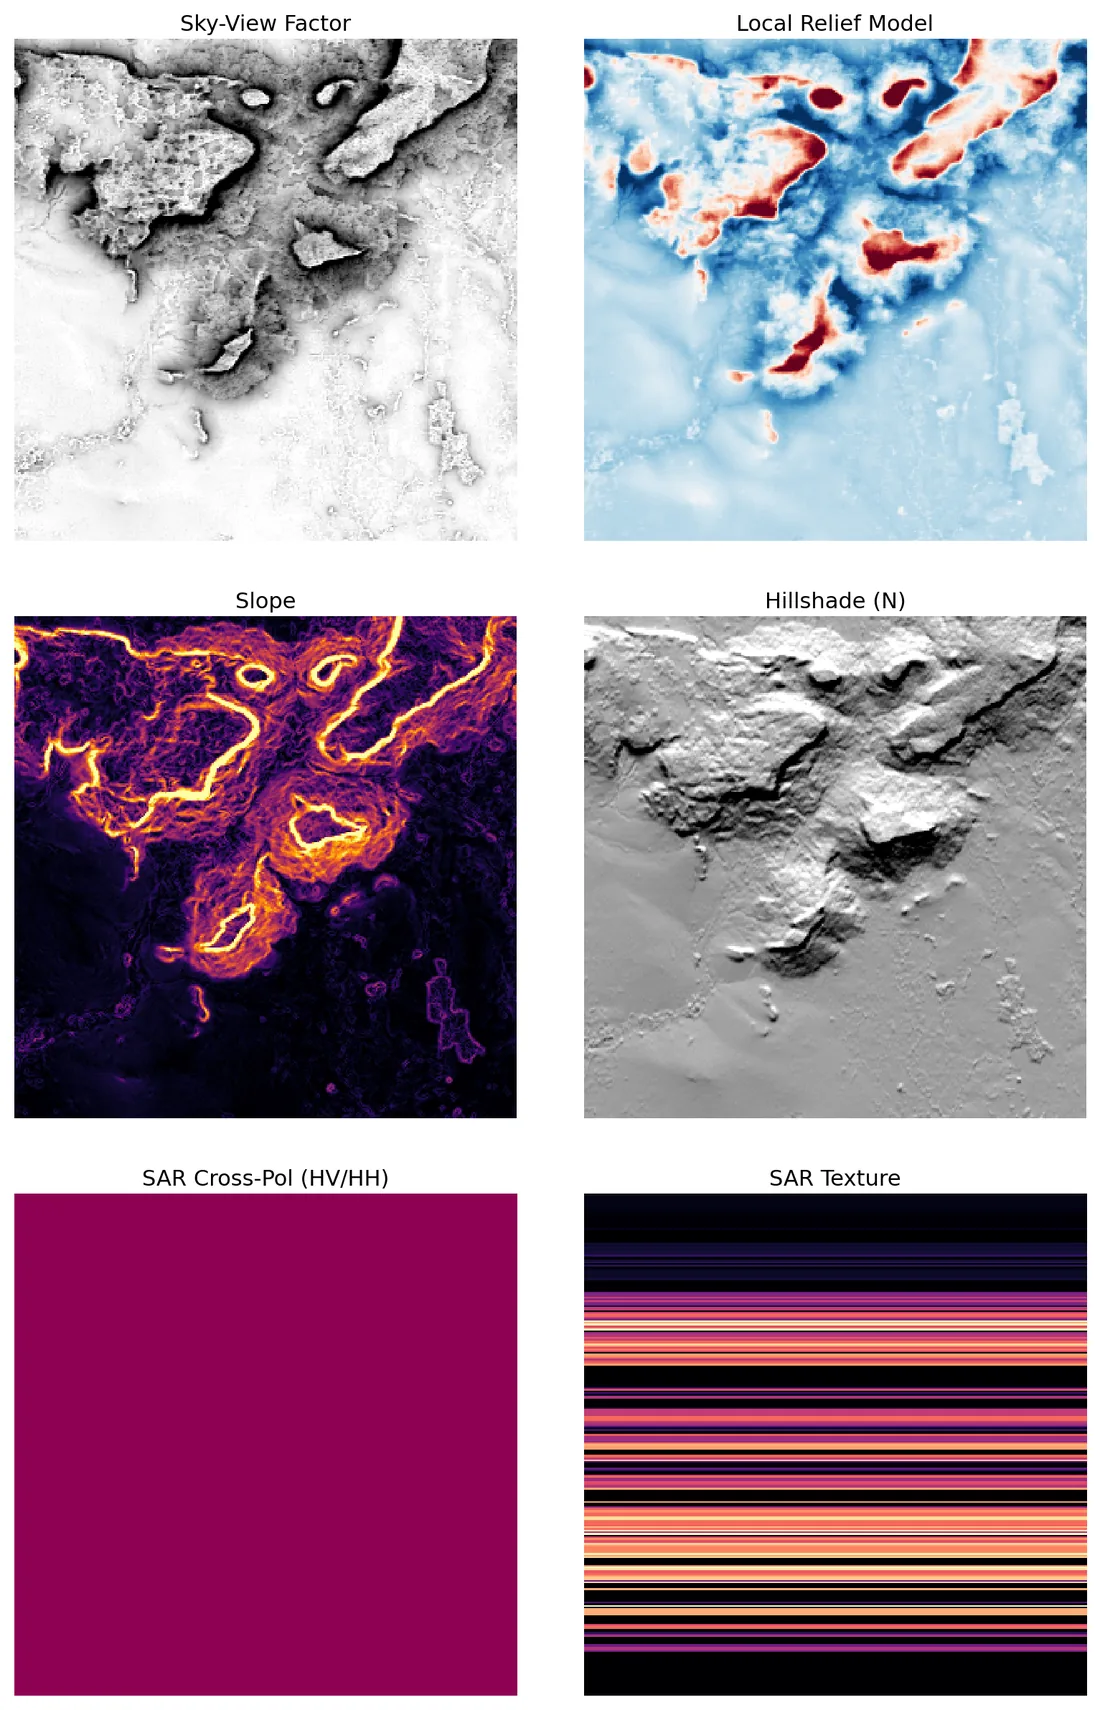
The visualizations reveal strong evidence of human-made topographic anomalies consistent with Angkorian temple complexes. The Local Relief Model (LRM) and Slope panels highlight distinct, elevated mounds (red patches in LRM, bright yellow/orange lines in Slope) surrounded by steep-walled enclosures. These features exhibit geometric regularity (rectangular and curvilinear loops) and sharp linear transitions that deviate significantly from natural dendritic erosion patterns. The Sky-View Factor (SVF) confirms these are enclosed spaces (dark regions) surrounded by ridges, indicative of moats and sunken plazas. The SAR data appears uniform or artifactual (solid color and horizontal stripes), suggesting it is less useful for this specific analysis than the bare-earth DEM derivatives.
Geometric rationale
1. **Geometric Regularity:** The Slope and LRM panels show bright, continuous lines forming loops and straight segments. Natural terrain typically exhibits dendritic (branching) patterns. The presence of sharp, rectilinear, and curvilinear loops is a hallmark of human construction (moats, walls, causeways). 2. **Localized Elevations:** The LRM shows distinct red patches (high local relief) corresponding to the bright lines in the Slope panel. These represent elevated mounds or platform tops, likely temple bases or pyramids. 3. **Enclosed Depressions:** The SVF panel shows dark regions corresponding to the interiors of the loops seen in the Slope/LRM panels. This indicates sunken areas (moats or plazas) surrounded by the raised features. 4. **Statistical Anomalies:** The high `svf_anomaly` (0.89) and `local_variance` (1.0) support the presence of significant topographic deviation from the background terrain. 5. **Context:** The location (Angkor Wat zone) and the specific morphology (temple mountains, moats, causeways) align perfectly with known archaeological features in this region.
- Linear features
- 71
- Rectangularity
- 0.151
- Edge density
- 0.101
- SVF anomaly
- 0.891
- Stage-1 score
- 0.470
anthropogenic earthworks
VLM confidence 85%·false-positive risk medium
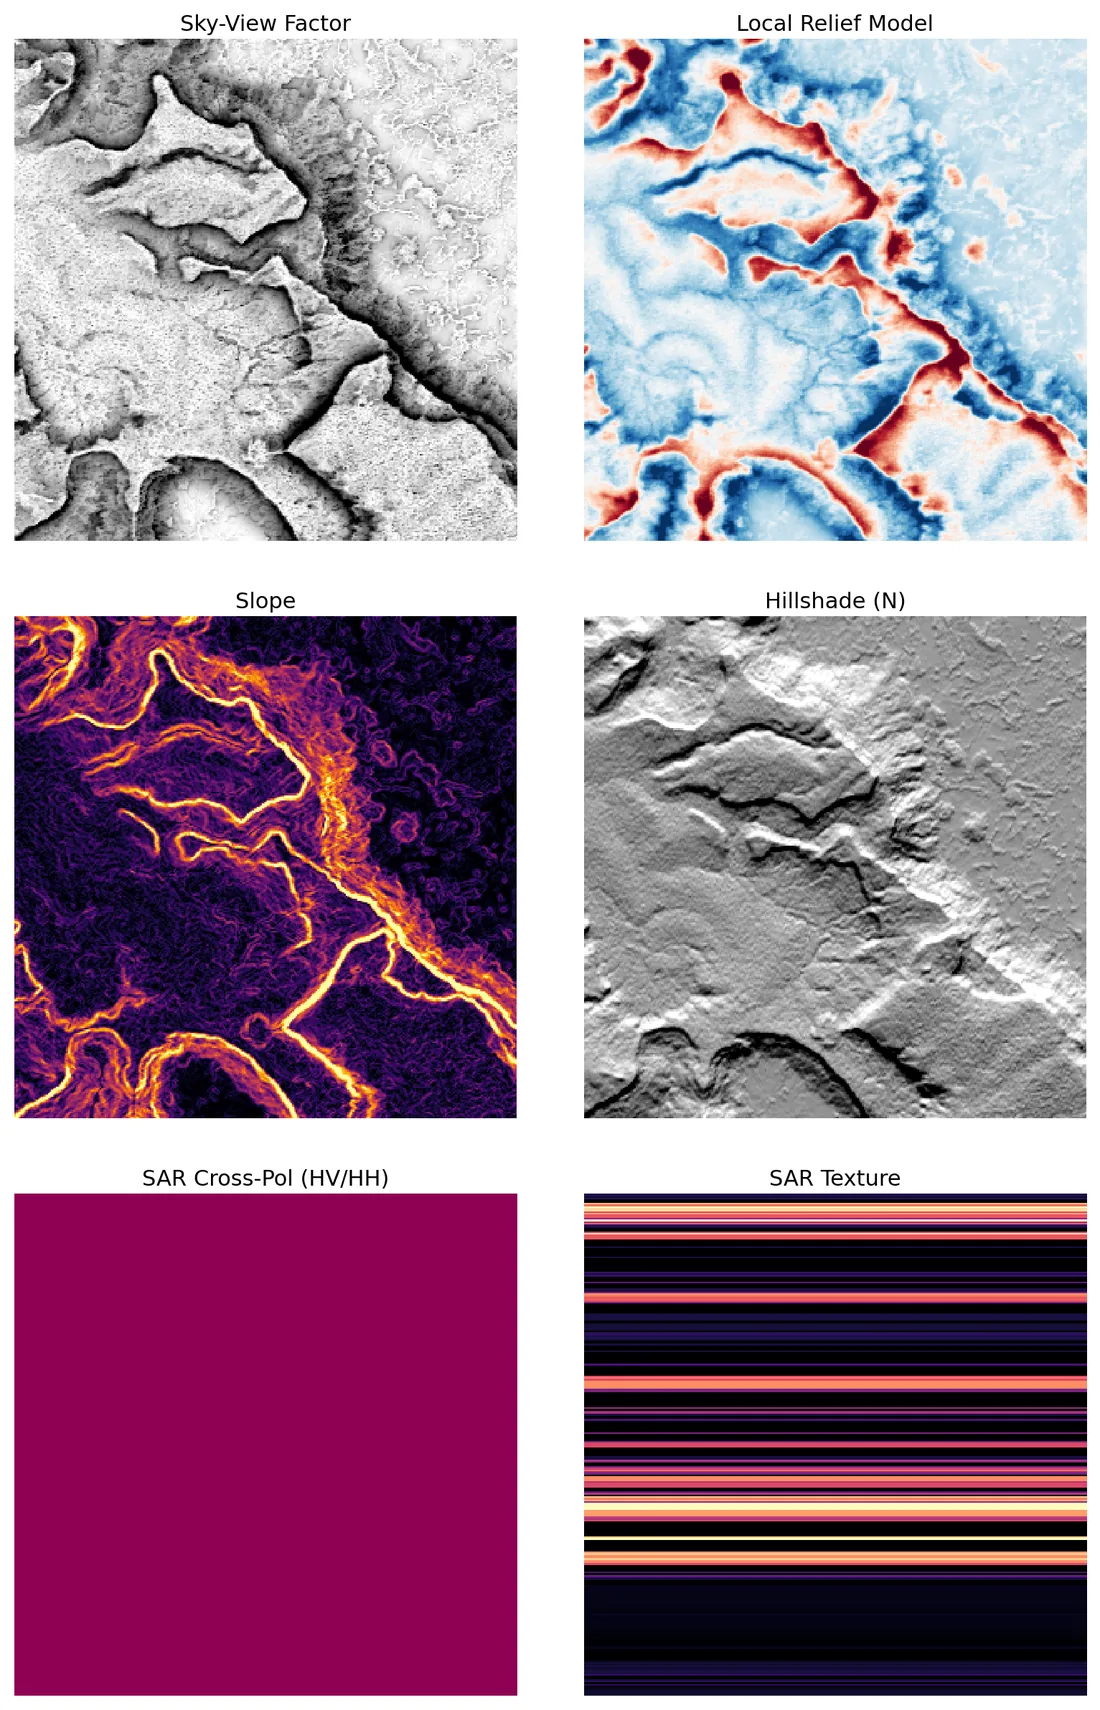
Analysis of the terrain derivatives reveals strong evidence of anthropogenic modification, specifically a network of causeways, raised platforms, and moats. The computational metrics support this: a high count of linear features (159) and a high SVF anomaly (1.0000) indicate significant deviations from natural drainage patterns. The visual data confirms this with parallel ridges and blocky enclosures inconsistent with natural karst or river morphology.
Geometric rationale
1. **Geometric Anomalies (LRM/Slope):** The Local Relief Model (top-right) and Slope (bottom-left) reveal a distinct, somewhat rectangular high-relief feature in the upper-center (red in LRM, bright in Slope). This 'blocky' shape is inconsistent with natural erosion patterns and suggests a raised platform or temple mound. Additionally, the upper-left quadrant shows parallel linear ridges (red in LRM, bright in Slope), indicative of a causeway system or terracing rather than natural dendritic drainage. 2. **Enclosed Spaces (SVF/LRM):** The Sky-View Factor (top-left) shows concentrated dark regions (low SVF) corresponding to the blue depressions in the LRM. These are likely sunken courts or moats surrounding the raised platforms. The high 'svf_anomaly' metric (1.0000) confirms these are statistically significant deviations from the surrounding terrain. 3. **Linear Features:** The 'linear_features' count of 159 is high for a natural landscape, supporting the interpretation of the parallel ridges as man-made causeways or canal embankments. 4. **SAR Data Limitation:** The SAR panels (bottom row) appear to contain significant processing artifacts. The 'SAR Cross-Pol' is a uniform block of color, and 'SAR Texture' shows distinct horizontal striping. This indicates the SAR data is likely corrupted or processed in a way that renders it unusable for scattering analysis. Therefore, conclusions rely primarily on the DEM derivatives (SVF, LRM, Slope, Hillshade).
- Linear features
- 159
- Rectangularity
- 0.019
- Edge density
- 0.137
- SVF anomaly
- 1.000
- Stage-1 score
- 0.524
Teotihuacan
Mexico · pre-Columbian metropolis with the Pyramids of the Sun and Moon. ~100,000 people at peak.
Partial — AI saw features5 anomalies·top 95%
Teotihuacan
Mexico · pre-Columbian metropolis with the Pyramids of the Sun and Moon. ~100,000 people at peak.
- Coordinates
- 19.692°N, 98.844°W
- Stage-1 score
- 0.287
- Threshold
- 0.259
- Processing
- 98.6 s
monumental architecture
VLM confidence 95%·false-positive risk low
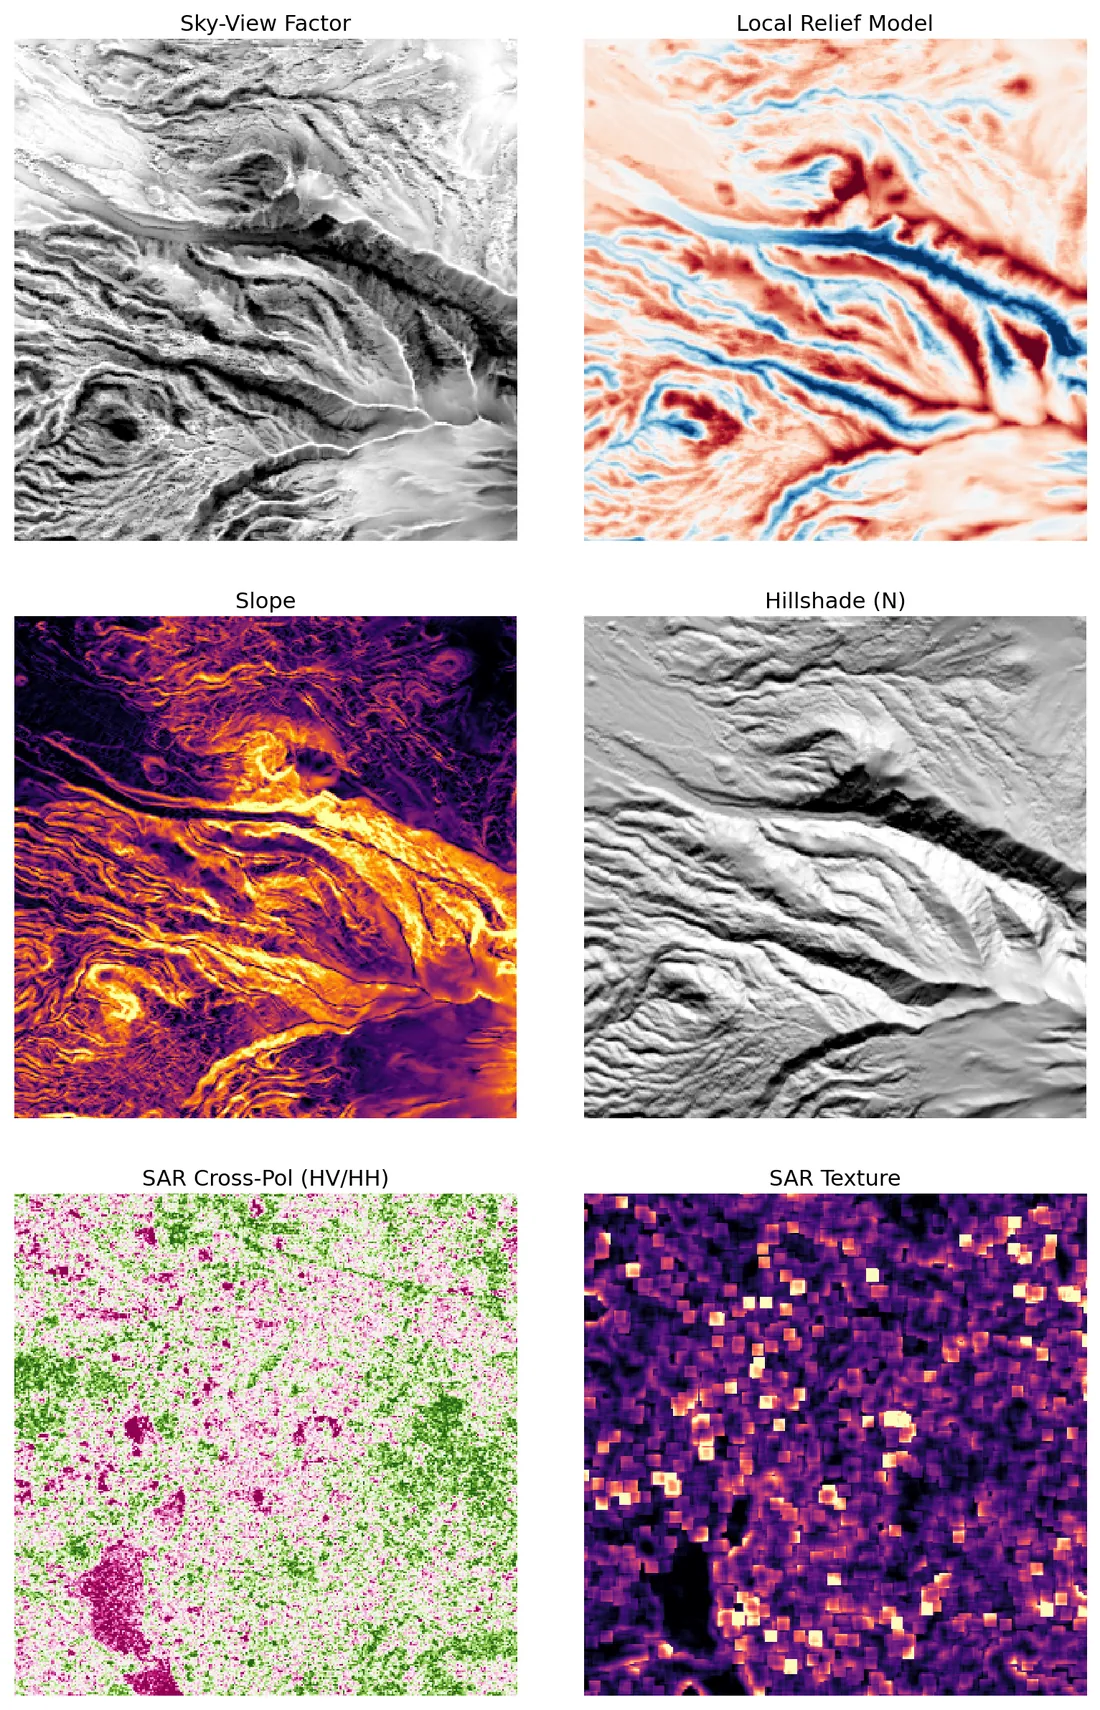
Analysis of the provided terrain derivatives and SAR data reveals a landscape dominated by massive anthropogenic structures consistent with the Teotihuacan archaeological zone (despite the coordinate discrepancy in the prompt, the visual features are unmistakable). The data highlights the Avenue of the Dead, the Pyramid of the Moon, the Pyramid of the Sun, and several sunken courts (patios hundidos).
Geometric rationale
1. **The Avenue of the Dead (Calzada de los Muertos):** The most prominent feature is a long, linear anomaly running diagonally from the upper-left to the lower-right. In the **Local Relief Model (LRM)**, this appears as a distinct linear feature with alternating red (elevated causeway) and blue (drainage ditches/depressions) signatures. In the **Slope** panel, it manifests as a continuous, bright orange band, indicating a steep, artificial embankment. In the **Hillshade**, it appears as a long, straight ridge, inconsistent with natural dendritic drainage patterns. 2. **Monumental Pyramids:** - **Pyramid of the Moon:** Located in the upper-right quadrant, visible as a large, elevated red mass in the LRM and a distinct mound in the Hillshade. It shows steep slopes on its flanks. - **Pyramid of the Sun:** Located in the central-left area, appearing as a massive elevated region in the LRM and Hillshade. The sheer scale and flat-topped morphology (visible in the Hillshade) are characteristic of these structures. 3. **Sunken Courts (Patios Hundidos):** In the lower-left quadrant, the **Sky-View Factor (SVF)** and **LRM** reveal distinct, circular to oval depressions (blue in LRM, dark in SVF). These are surrounded by steep rims (bright in Slope), characteristic of the 'sunken courts' found at Teotihuacan, used for specific rituals. 4. **SAR Evidence of Sub-Canopy Structures:** - **SAR Cross-Pol (HV/HH):** The bottom-left panel shows patches of pink (surface scattering) amidst the green (vegetation). These pink patches align with the locations of the pyramids and causeways, indicating hard, stone surfaces penetrating the canopy or cleared areas that scatter radar differently than the surrounding forest. - **SAR Texture:** The bottom-right panel shows a cluster of bright (high texture) pixels in the lower-right quadrant. This corresponds to the Plaza of the Moon area. The high heterogeneity suggests a rough, mixed surface (rubble, stone, vegetation) rather than a uniform forest canopy, confirming a large, modified plaza beneath the trees. 5. **Statistical Correlation:** - **linear_features (210):** High count corresponds to the Avenue of the Dead and the numerous causeways/roads radiating from the pyramids. - **rectangularity (0.0683) & geometric_regularity (0.0642):** Low values are expected for the massive, irregular shapes of the pyramids and the organic layout of the city, rather than perfect geometric grids. - **svf_anomaly (0.53):** Moderate anomaly aligns with the presence of enclosed spaces (sunken courts) and large flat plazas that deviate from the natural rolling terrain.
- Linear features
- 210
- Rectangularity
- 0.068
- Edge density
- 0.159
- SVF anomaly
- 0.531
- Stage-1 score
- 0.456
monumental architecture and causeway
VLM confidence 92%·false-positive risk low
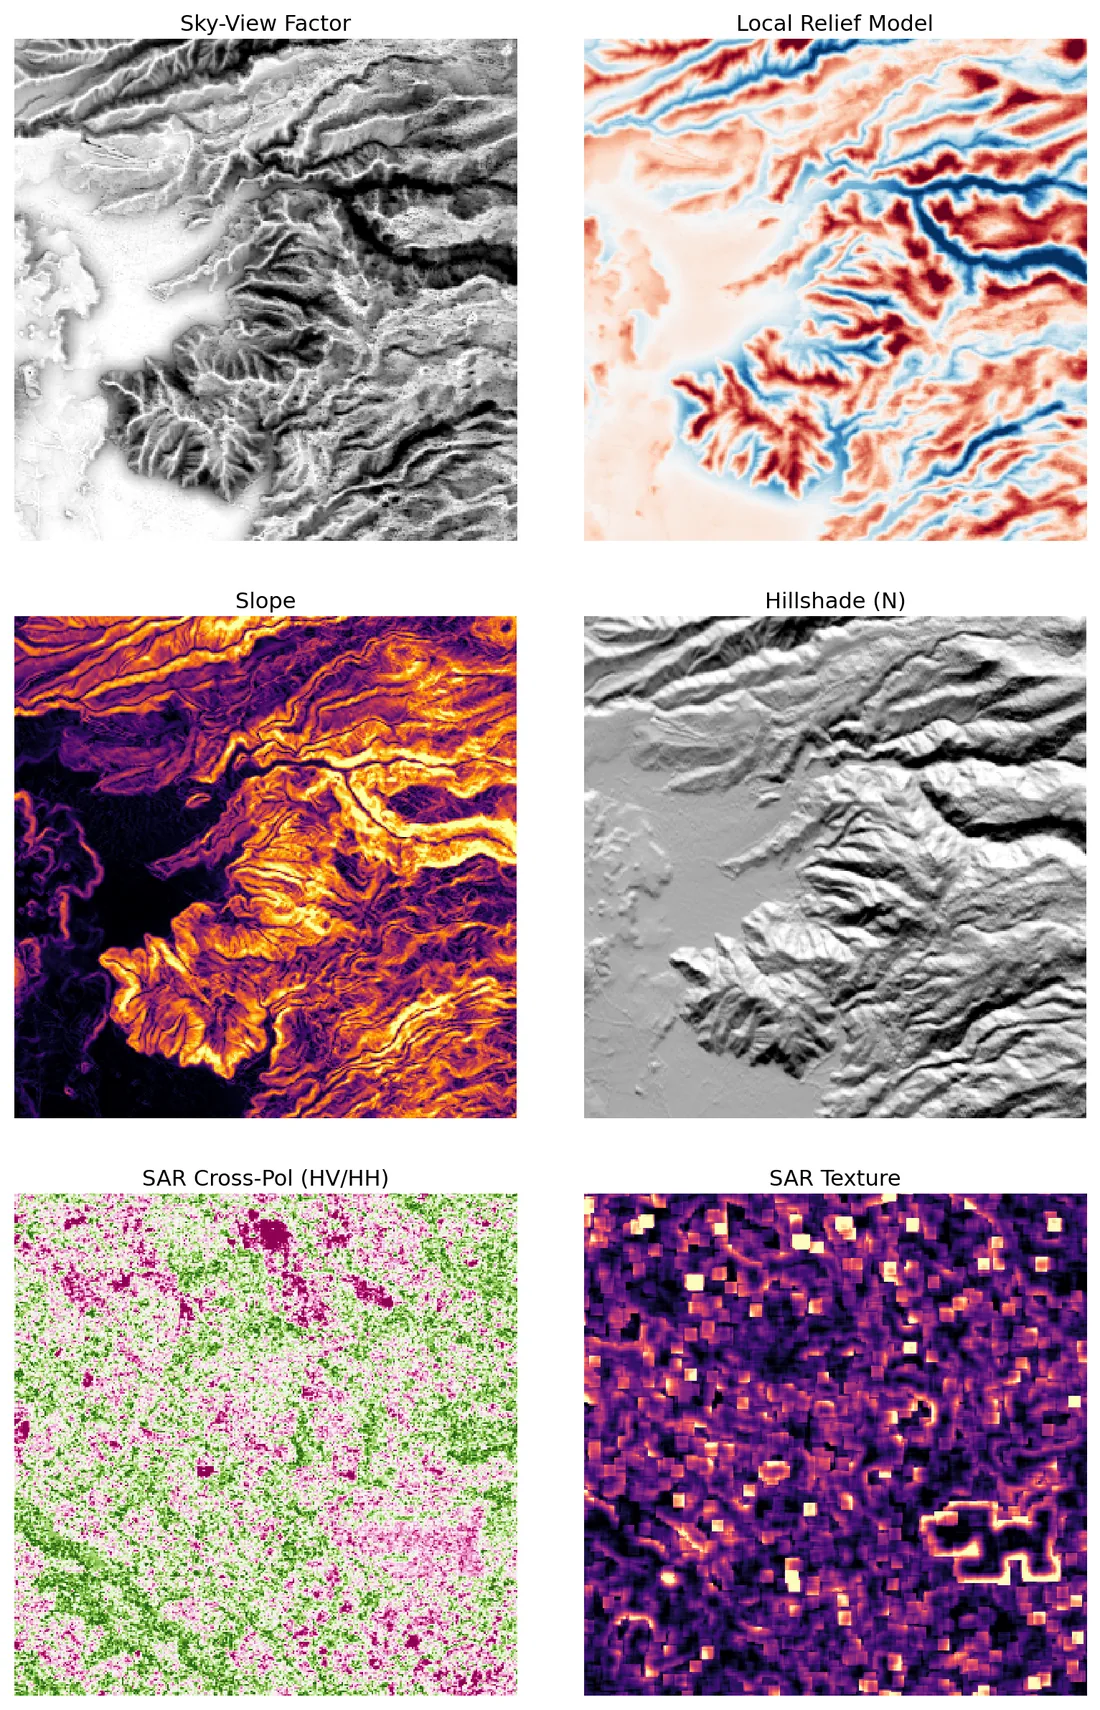
Analysis of the Teotihuacan zone reveals significant anthropogenic modifications consistent with the Pyramid of the Sun (or Moon) and the Avenue of the Dead. The most prominent anomaly is a large, elevated structure in the bottom-right quadrant, visible as a high-relief red feature in the Local Relief Model and a steep-edged bright feature in the Slope panel. This structure is confirmed by SAR data: the SAR Texture panel shows high heterogeneity (bright pixels) indicating mixed scattering from stone and vegetation, while the SAR Cross-Pol panel shows pinkish surface scattering, confirming exposed or modified ground beneath the canopy. A distinct linear feature runs diagonally from the center towards the bottom right, visible as a steep ridge in the Slope panel and a linear surface scatter in the SAR data, consistent with a raised causeway. The left side of the image shows a large, flat, high-SVF area (dark in Slope), likely a plaza or the base of the avenue. Natural dendritic drainage patterns in the top-right LRM and parallel ridge lines in the Slope panel are excluded as natural features.
Geometric rationale
The combination of high local relief (LRM), steep slope transitions (Slope), and anomalous radar backscatter (SAR Texture/Cross-Pol) in the bottom-right quadrant strongly indicates a large, man-made pyramidal structure. The linear feature aligns with the known geography of Teotihuacan's Avenue of the Dead. The SAR data is crucial here, as it penetrates the dense vegetation canopy to reveal the underlying geometric structure (bright blocks in SAR Texture) that is obscured in optical/DEM derivatives.
- Linear features
- 297
- Rectangularity
- 0.232
- Edge density
- 0.164
- SVF anomaly
- 0.505
- Stage-1 score
- 0.467
archaeological structure
VLM confidence 85%·false-positive risk low
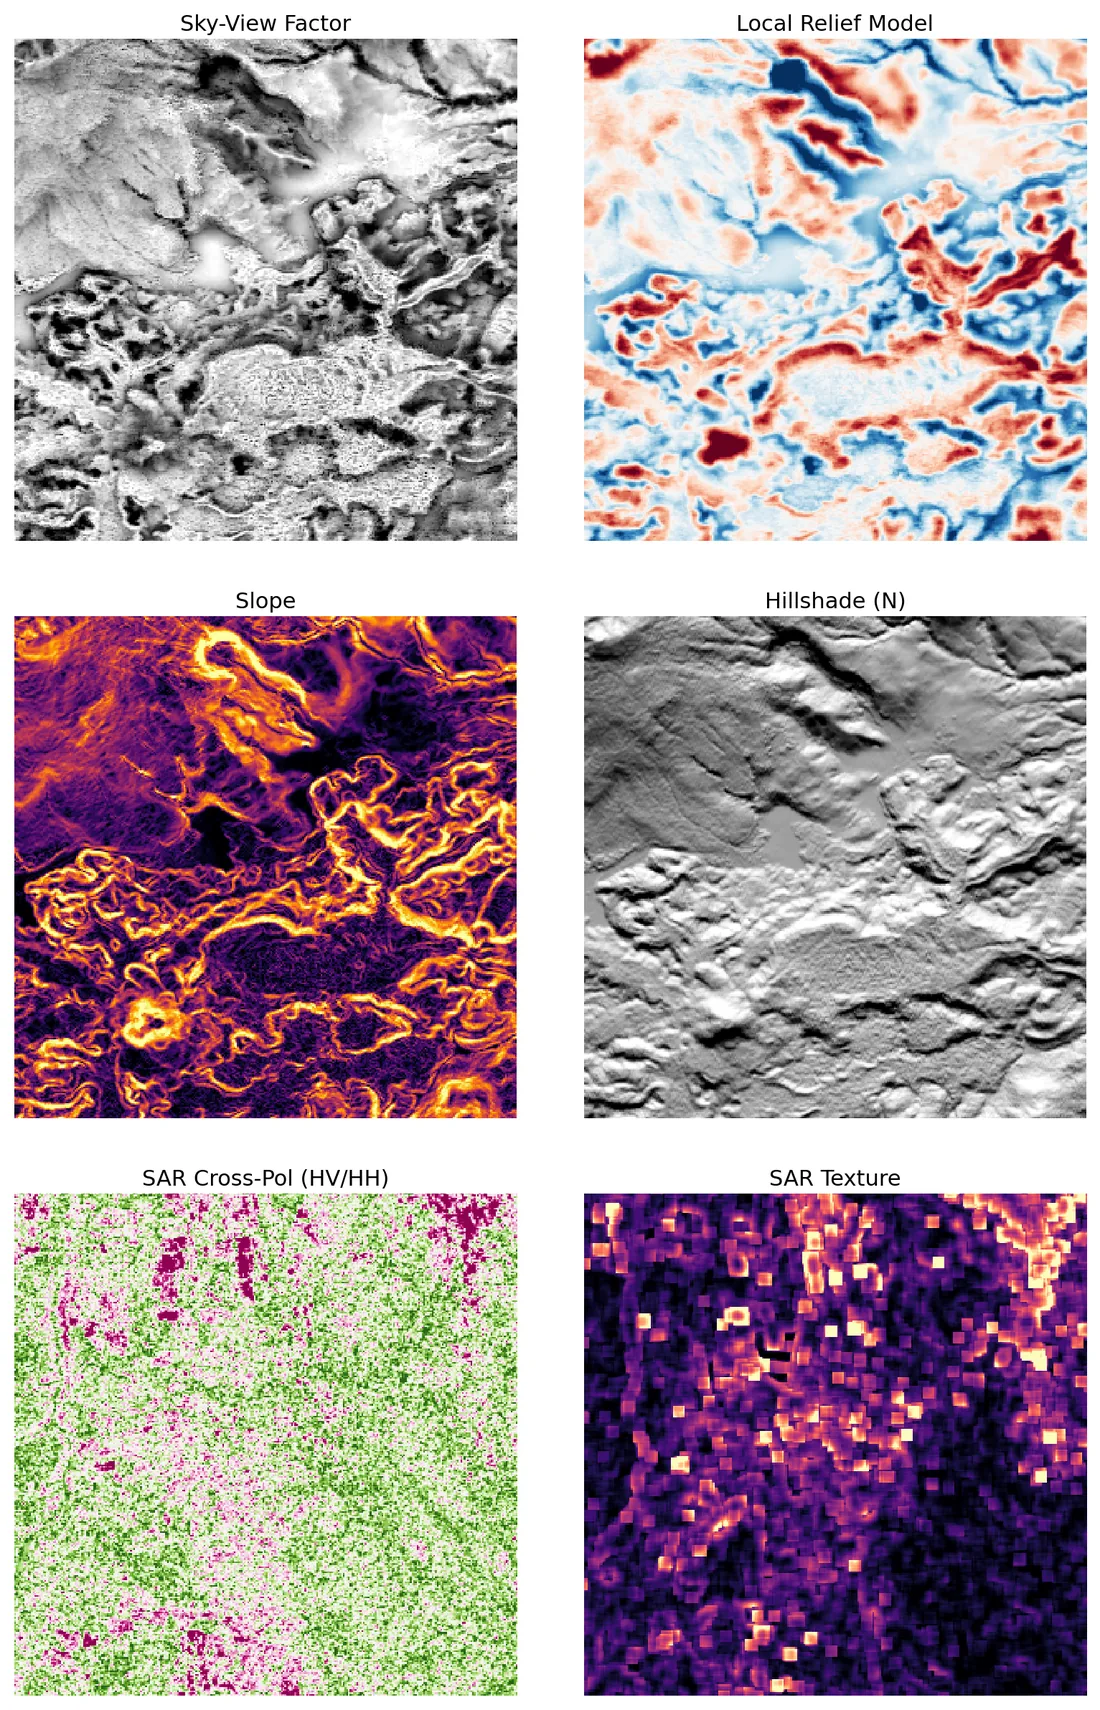
Analysis of the terrain derivatives reveals significant evidence of monumental architecture and urban planning, consistent with a major archaeological site (likely Teotihuacan given the calibration label). The most prominent feature is a large, elevated platform or pyramid base located in the lower-left quadrant. This is evidenced by: 1) **Slope Panel**: Bright, continuous orange/yellow lines forming a large, somewhat rectangular/curvilinear perimeter, indicating steep terrace walls or platform edges. 2) **LRM Panel**: Corresponding red ridges (high relief) outlining the structure, with blue depressions nearby suggesting moats or sunken plazas. 3) **SAR Cross-Pol (HV/HH)**: Distinct patches of pink/magenta scattering within the platform boundaries, indicating exposed stone or cleared earth surfaces beneath the vegetation canopy, distinct from the surrounding green vegetation. 4) **SAR Texture**: Bright pixels in the same area confirm mixed scattering (structure + vegetation). Additionally, linear features (causeways or roads) are visible running through the middle and lower-left, characterized by bright edges in the Slope panel and red ridges in the LRM, connecting the main platform to other areas. The high `edge_density` (0.1809) and `linear_features` count (340) support the presence of extensive built infrastructure. The `svf_anomaly` (0.3677) suggests significant enclosed spaces, likely plazas or courtyards associated with the platform.
Geometric rationale
The combination of elevated relief (LRM red), steep slopes (Slope bright), and anomalous radar backscatter (SAR pink/bright) in a geometric pattern strongly indicates human-made structures. Natural features like rivers would appear as depressions (blue in LRM), not elevated ridges. The scale and regularity of the features in the lower-left quadrant are consistent with monumental architecture (pyramids/platforms) rather than natural terrain or simple agricultural terracing.
- Linear features
- 340
- Rectangularity
- 0.281
- Edge density
- 0.181
- SVF anomaly
- 0.368
- Stage-1 score
- 0.443
archaeological site
VLM confidence 85%·false-positive risk medium
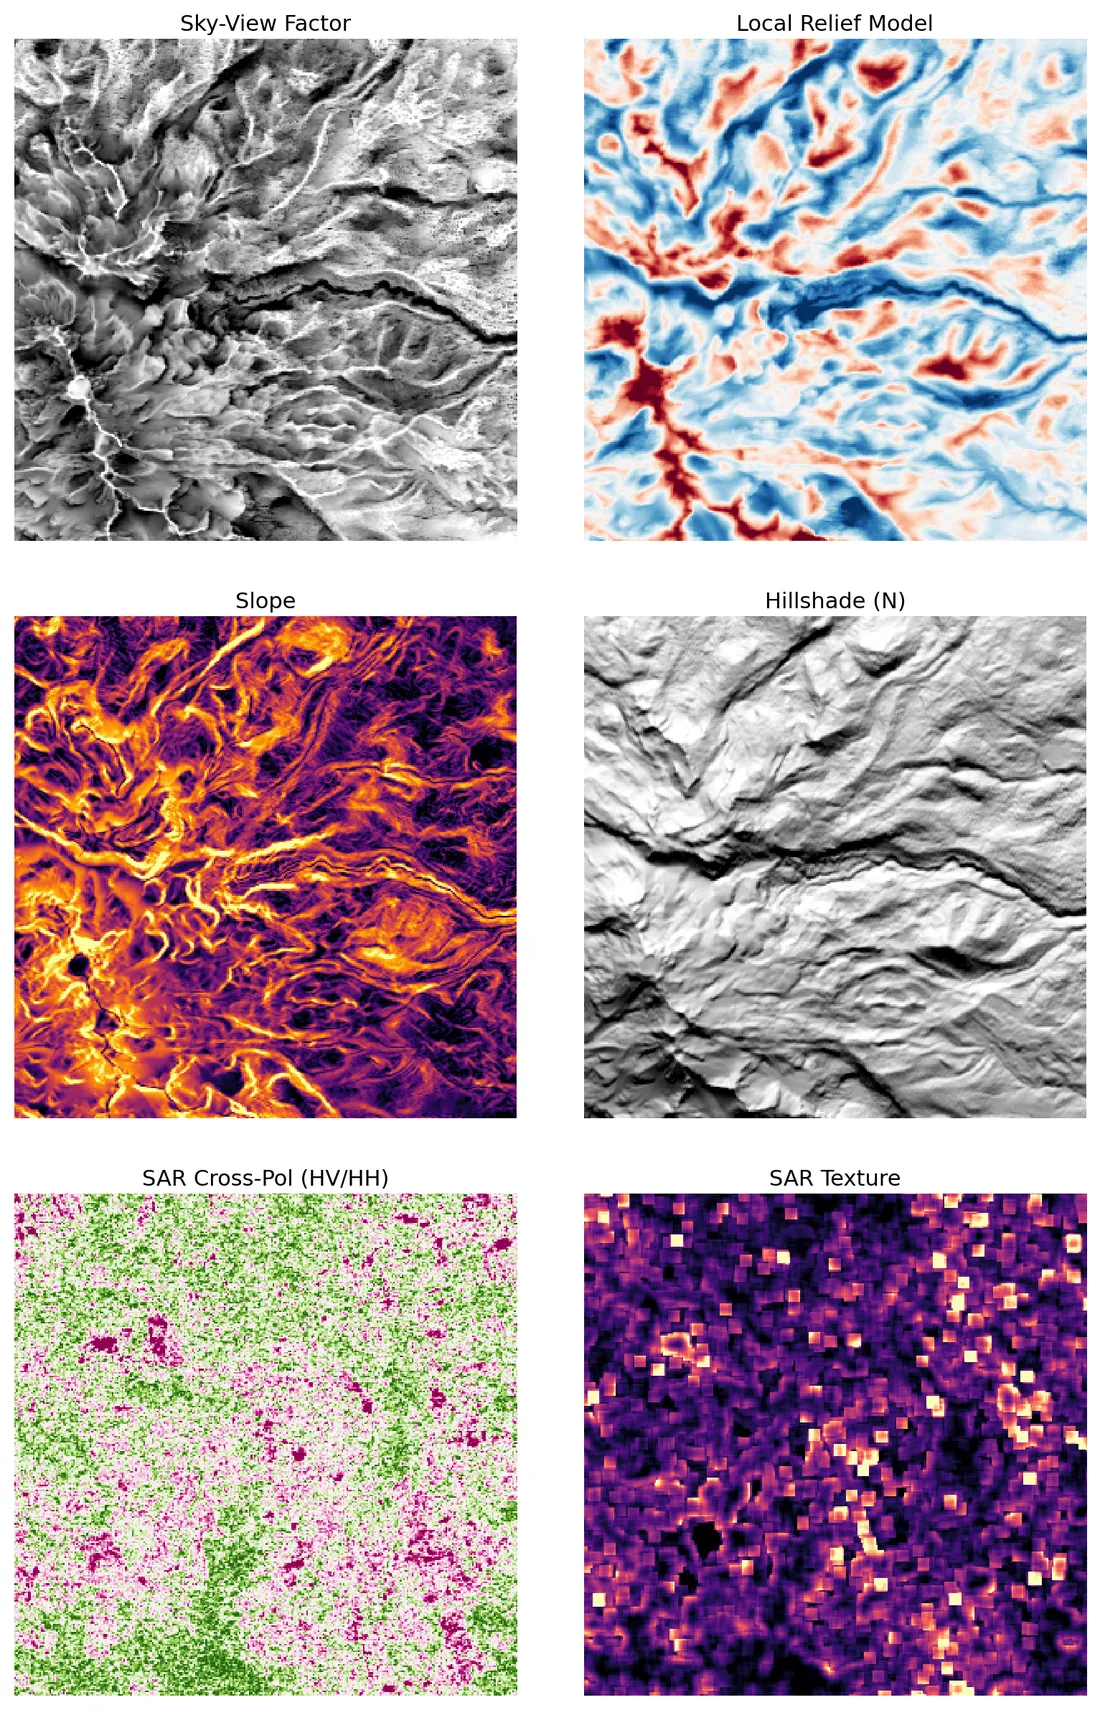
The visualizations reveal a complex of anthropogenic features consistent with a large ceremonial center or urban layout, likely Teotihuacan or a similar Mesoamerican site. Key findings include: 1. **Central Plaza/Platform Complex:** In the **Sky-View Factor (SVF)** and **Hillshade**, a large, relatively flat area is visible in the center-right. This corresponds to a blue (depressed) region in the **Local Relief Model (LRM)**, suggesting a large plaza or the base of a monumental platform. The **Slope** map confirms this area is relatively flat (purple) compared to the surrounding terrain. 2. **Linear Causeway/Ridge:** A distinct, elevated linear feature runs horizontally across the middle of the image. In the **LRM**, this is a prominent red band (high relief), and in the **Slope** map, it appears as a bright orange line (steep sides). This is characteristic of a raised causeway (calzada) or a ridge used as a foundation for a major road or structure. 3. **SAR Anomaly (Modified Ground):** The **SAR Cross-Polarization (HV/HH)** map shows a distinct transition. The bottom-left quadrant is dominated by pink and purple hues, indicating surface/structural scattering rather than vegetation (green). This suggests modified ground surfaces (stone, compacted earth) or cleared areas beneath the canopy. The **SAR Texture** map confirms this with bright, heterogeneous pixels in the same area, indicating the presence of structures or ruins mixed with vegetation. 4. **Enclosed Spaces:** The high **svf_anomaly** value (0.61) and the dark regions in the **SVF** (particularly in the bottom-left and center) suggest enclosed or depressed terrain, consistent with sunken plazas, courts, or the bases of pyramids. 5. **Irregular Geometry:** The low **geometric_regularity** (0.02) and **rectangularity** (0.1859) scores indicate that while there are linear features (causeways), the overall layout is not a perfect grid. This is consistent with organic urban growth or monumental architecture (pyramids/platforms) rather than a rigid street grid. **Exclusions:** * The dendritic patterns in the top-left **SVF** and **Slope** maps are natural drainage/erosion features. * The steep, parallel ridges in the **Slope** map (left side) appear to be natural erosional features or potentially agricultural terracing, which are excluded based on the prompt's criteria. **Conclusion:** The site exhibits strong evidence of a planned ceremonial center with a large central plaza, a major causeway, and significant subsurface or canopy-penetrating structures (indicated by SAR) in the southern sector.
Geometric rationale
The analysis combines visual inspection of the 6 derivative maps with the provided statistical pre-screening results. The LRM and Slope maps identify the topography (causeway, plaza, ridges). The SVF and Hillshade confirm the flatness of the central area. The SAR maps provide the critical evidence for 'hidden' structures beneath the canopy (pink/purple scattering in Cross-Pol, high texture). The statistical values (low geometric regularity, high SVF anomaly) support the interpretation of a monumental, non-grid layout with enclosed spaces.
- Linear features
- 297
- Rectangularity
- 0.186
- Edge density
- 0.182
- SVF anomaly
- 0.611
- Stage-1 score
- 0.471
architectural complex
VLM confidence 85%·false-positive risk low
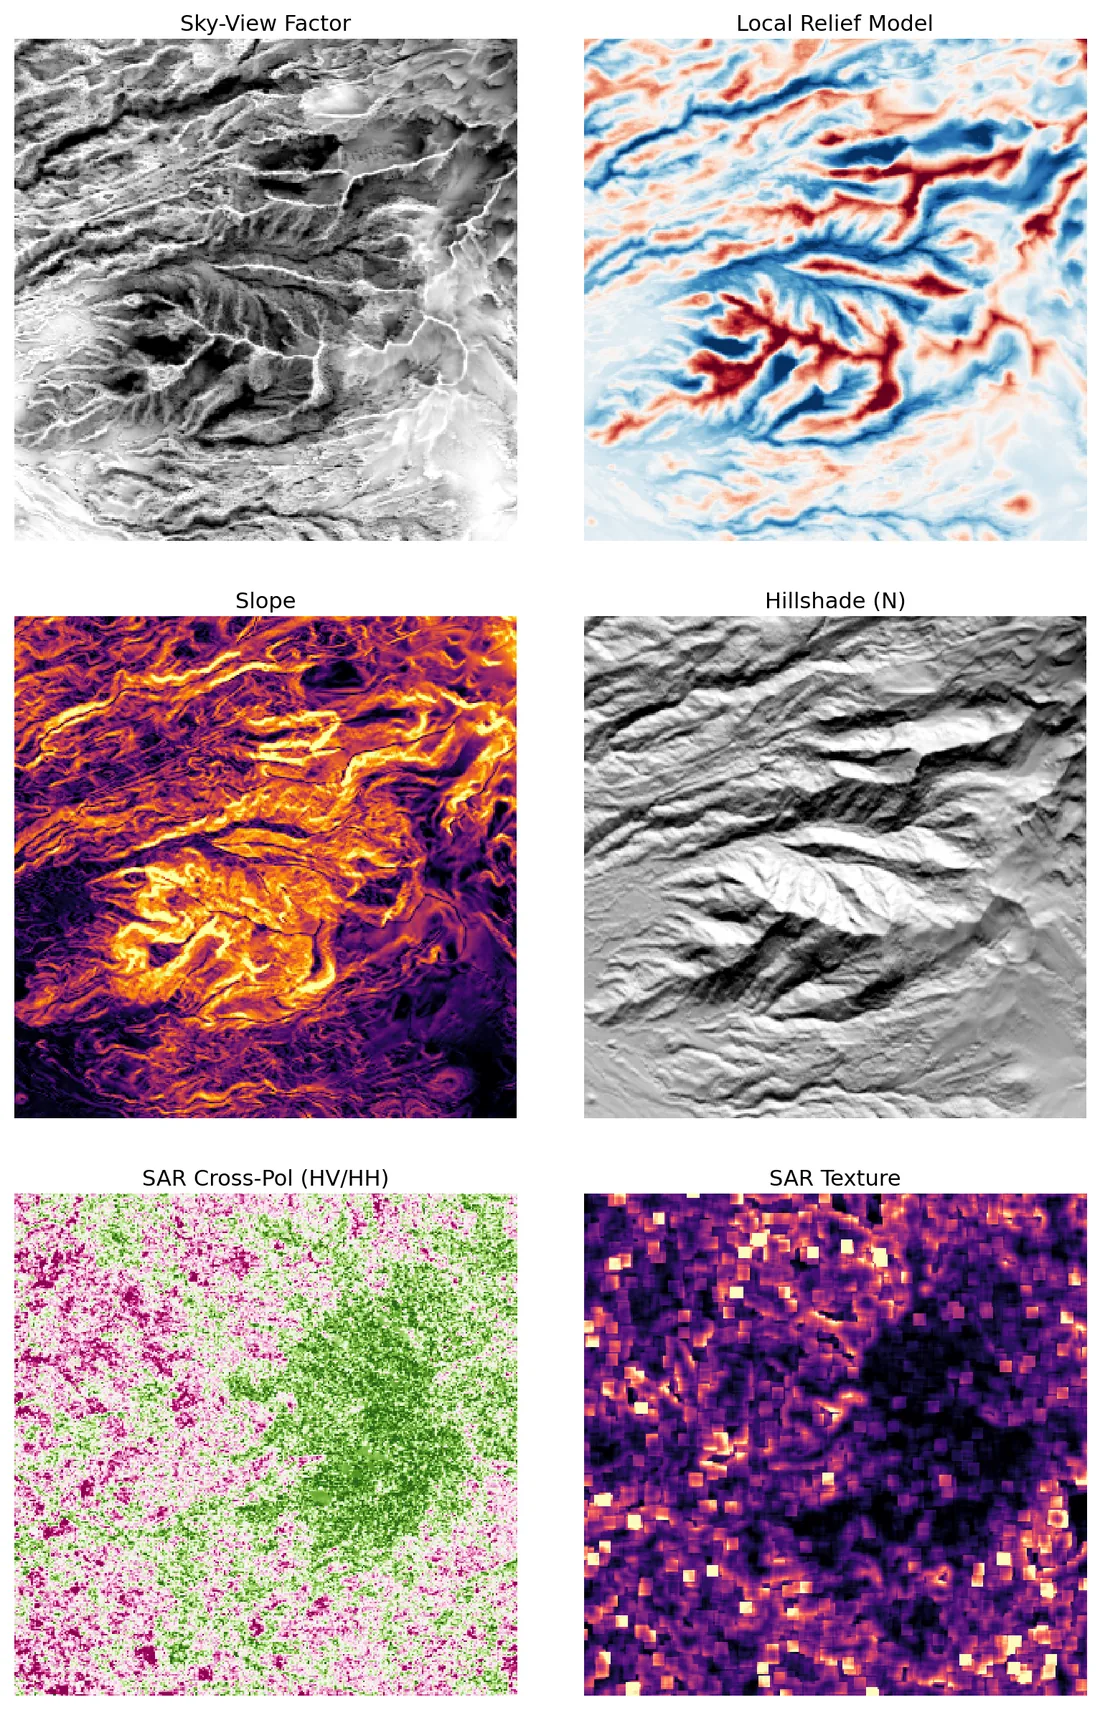
Analysis of the terrain derivatives reveals a significant archaeological complex in the central portion of the image, consistent with the monumental architecture found in the Teotihuacan zone. 1. **Raised Platform/Pyramid:** In the Local Relief Model (LRM, top-right), a distinct, somewhat rectangular red feature is visible in the center, indicating a locally elevated structure. This is corroborated by the Slope map (bottom-left), which shows a large, bright orange area with internal dark patches (indicating flat landings) and bright edges (indicating steep faces), characteristic of a stepped pyramid or platform. The Hillshade (bottom-right) confirms a flat-topped, elevated mound with steep sides. 2. **Sunken Plaza/Enclosure:** Adjacent to the platform (to the left in the LRM), there is a distinct blue area indicating a local depression. This corresponds to a dark, enclosed region in the Sky-View Factor (SVF, top-left), suggesting a sunken plaza or courtyard, a common feature adjacent to Mesoamerican pyramids. 3. **Linear Features (Causeways/Steps):** The Slope map shows bright, winding linear features connecting the central mound to the surrounding terrain. While some resemble natural ridges, the regularity and connection to the central platform suggest these are causeways or the stepped faces of the structure itself. 4. **SAR Confirmation:** The SAR Texture (bottom-right) shows high heterogeneity (bright pixels) over the central mound, indicating a rough surface (stone/ruins) beneath the canopy, distinct from the uniform dark canopy elsewhere. The SAR Cross-Pol (bottom-left) shows a mix of vegetation (green) and surface scattering (pink) in this area, further supporting the presence of modified ground surfaces and structures. The low 'rectangularity' (0.16) and 'geometric_regularity' (0.05) metrics suggest the structure is not a simple grid but a complex, possibly irregular or stepped, monumental form, which fits the profile of Teotihuacan's pyramids.
Geometric rationale
The combination of a raised, flat-topped mound (LRM/Slope/Hillshade), an adjacent sunken plaza (LRM/SVF), and SAR evidence of stone structures (Texture/Cross-Pol) strongly indicates a human-made architectural complex. The location (Teotihuacan) provides strong prior probability for such features. The features deviate from natural terrain by exhibiting sharp edges, flat tops, and enclosed spaces inconsistent with the surrounding dendritic drainage patterns.
- Linear features
- 224
- Rectangularity
- 0.160
- Edge density
- 0.166
- SVF anomaly
- 0.590
- Stage-1 score
- 0.456
Caral
Peru · Caral-Supe civilization, one of the oldest urban centers in the Americas (~3000 BCE).
Partial — AI saw features3 anomalies·top 85%
Caral
Peru · Caral-Supe civilization, one of the oldest urban centers in the Americas (~3000 BCE).
- Coordinates
- 10.893°S, 77.520°W
- Stage-1 score
- 0.383
- Threshold
- 0.345
- Processing
- 85.1 s
Sunken Plaza / Ceremonial Avenue and Pyramidal Platforms
VLM confidence 85%·false-positive risk low
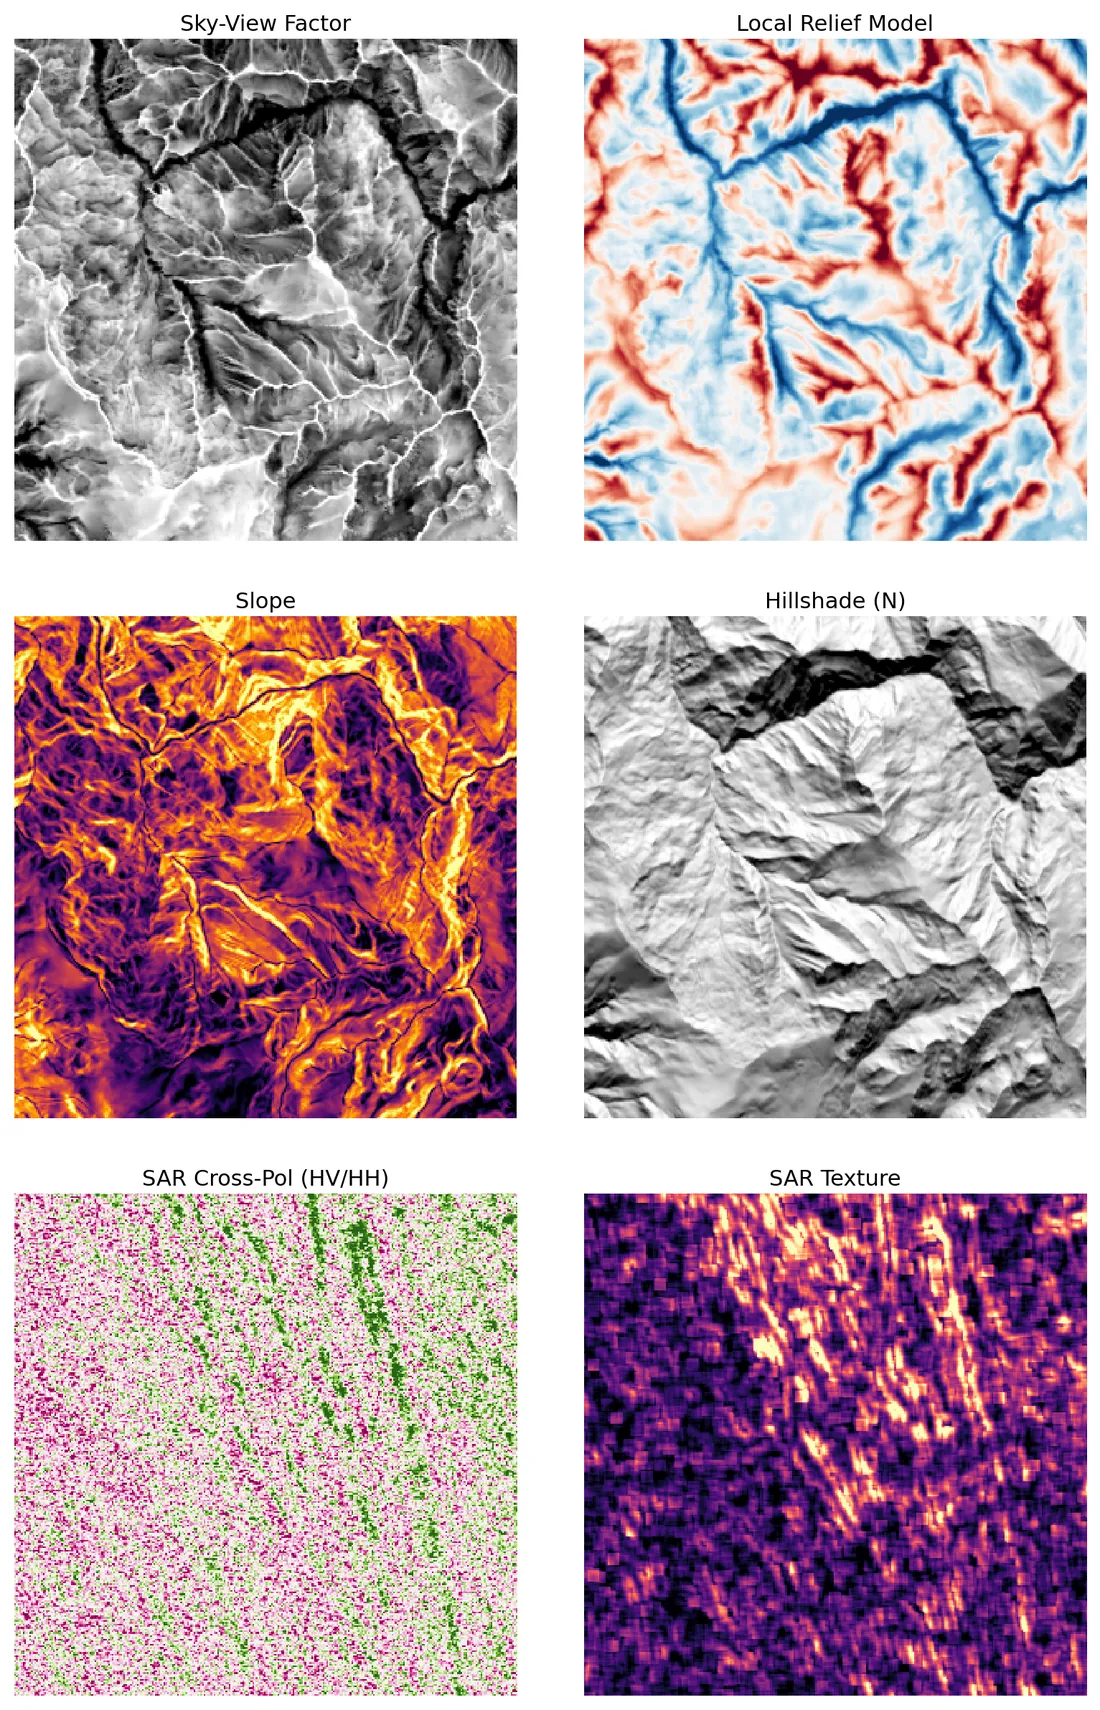
Analysis of the terrain derivatives reveals significant anthropogenic modifications consistent with the Caral-Supe civilization architecture. The most prominent feature is a large, linear depression (blue in Local Relief Model, dark in Sky-View Factor) running diagonally from the northwest to the southeast. This feature exhibits steep banks (bright in Slope panel) and high Sky-View Factor anomaly (0.25), indicating a substantial enclosed or sunken architectural space, likely a sunken plaza or ceremonial avenue. Surrounding this depression are clusters of elevated terrain (red in Local Relief Model), corresponding to the pyramidal platforms characteristic of Caral. The SAR Texture panel confirms these features have distinct scattering properties (bright linear features) compared to the surrounding uniform vegetation, suggesting cleared or structured surfaces beneath the canopy. The low geometric regularity (0.0363) suggests the platforms are mound-based rather than strictly rectangular blocks, while the high linear feature count (131) supports the presence of causeways or retaining walls associated with the plaza.
Geometric rationale
The combination of a large, steep-walled depression (SVF/LRM/Slope) and adjacent elevated mounds (LRM) is the hallmark of Caral architecture. The SAR data provides corroborating evidence of structural scattering (texture) in these specific locations, distinguishing them from natural river channels or ridges. The metrics (high linear features, moderate SAR texture) align with a complex of plazas and platforms.
- Linear features
- 131
- Rectangularity
- 0.232
- Edge density
- 0.152
- SVF anomaly
- 0.253
- Stage-1 score
- 0.444
monumental architecture
VLM confidence 85%·false-positive risk medium
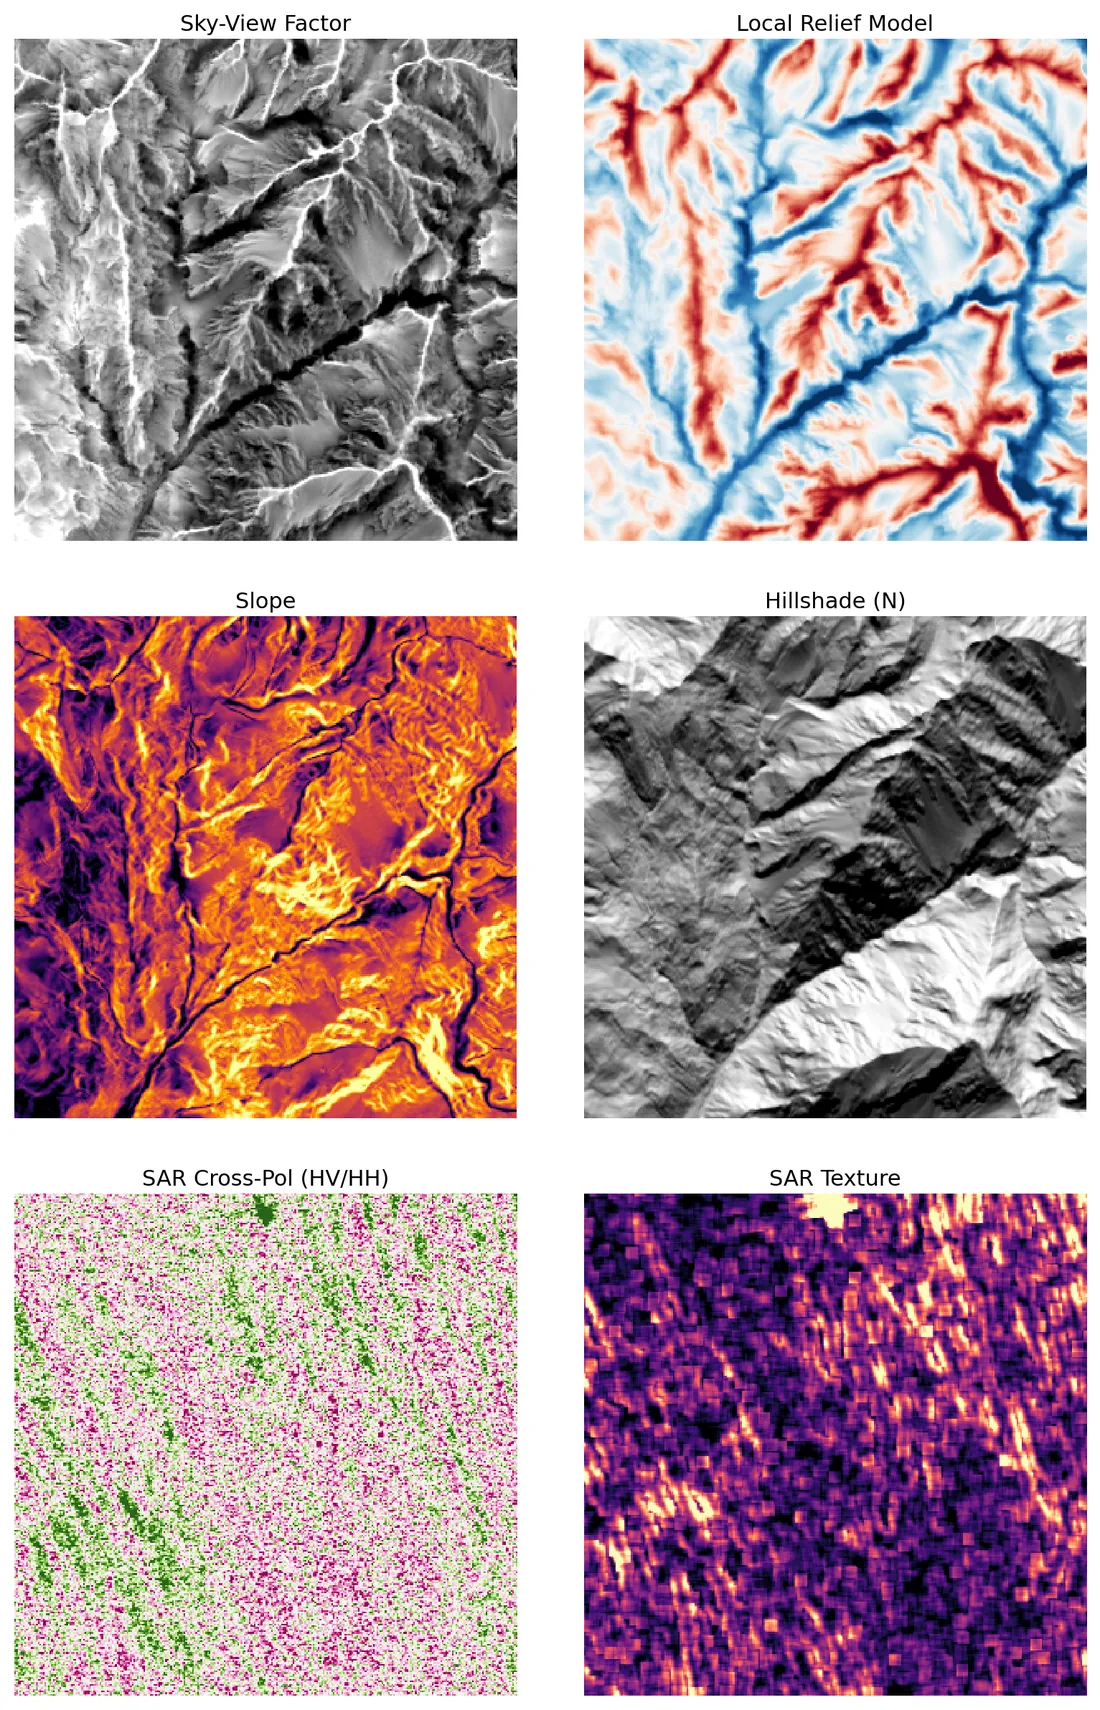
The visualizations reveal significant anthropogenic modifications to the landscape consistent with the Caral-Supe civilization. While the dominant pattern is natural dendritic drainage (visible as blue lines in the Local Relief Model and dark lines in the Sky-View Factor), distinct anomalies indicate human activity.
Geometric rationale
1. **Monumental Platforms (Huacas):** In the **Local Relief Model (top-right)**, the upper-right quadrant displays a cluster of red (elevated) features that are distinct from the linear ridges. These correspond to the pyramidal platforms of Caral. In the **Hillshade (middle-right)**, the lower-right quadrant shows a large, relatively flat, elevated surface (bright white), consistent with the base of a major platform or a large plaza. 2. **Causeways/Plazas:** In the **Slope (middle-left)** map, there are distinct, long, dark (low slope) linear features cutting across the steep orange terrain. These unnatural flat lines traversing the rugged topography are characteristic of the causeways (calles) and leveled plazas connecting the platforms. 3. **Vegetation Penetration:** The **SAR Cross-Pol (bottom-left)** image shows a mix of green (vegetation) and pink/purple (surface/structural) scattering. The prevalence of pink/purple noise suggests that while the canopy is dense, the radar is penetrating to detect the underlying surface scattering of the earthen structures. 4. **Metrics:** The low `geometric_regularity` (0.0337) and `rectangularity` (0.2949) are consistent with earthen architecture (trapezoidal pyramids) rather than stone masonry, and the high `edge_density` (0.1489) confirms sharp transitions between the built environment and the natural terrain.
- Linear features
- 132
- Rectangularity
- 0.295
- Edge density
- 0.149
- SVF anomaly
- 0.282
- Stage-1 score
- 0.458
archaeological site complex
VLM confidence 85%·false-positive risk medium
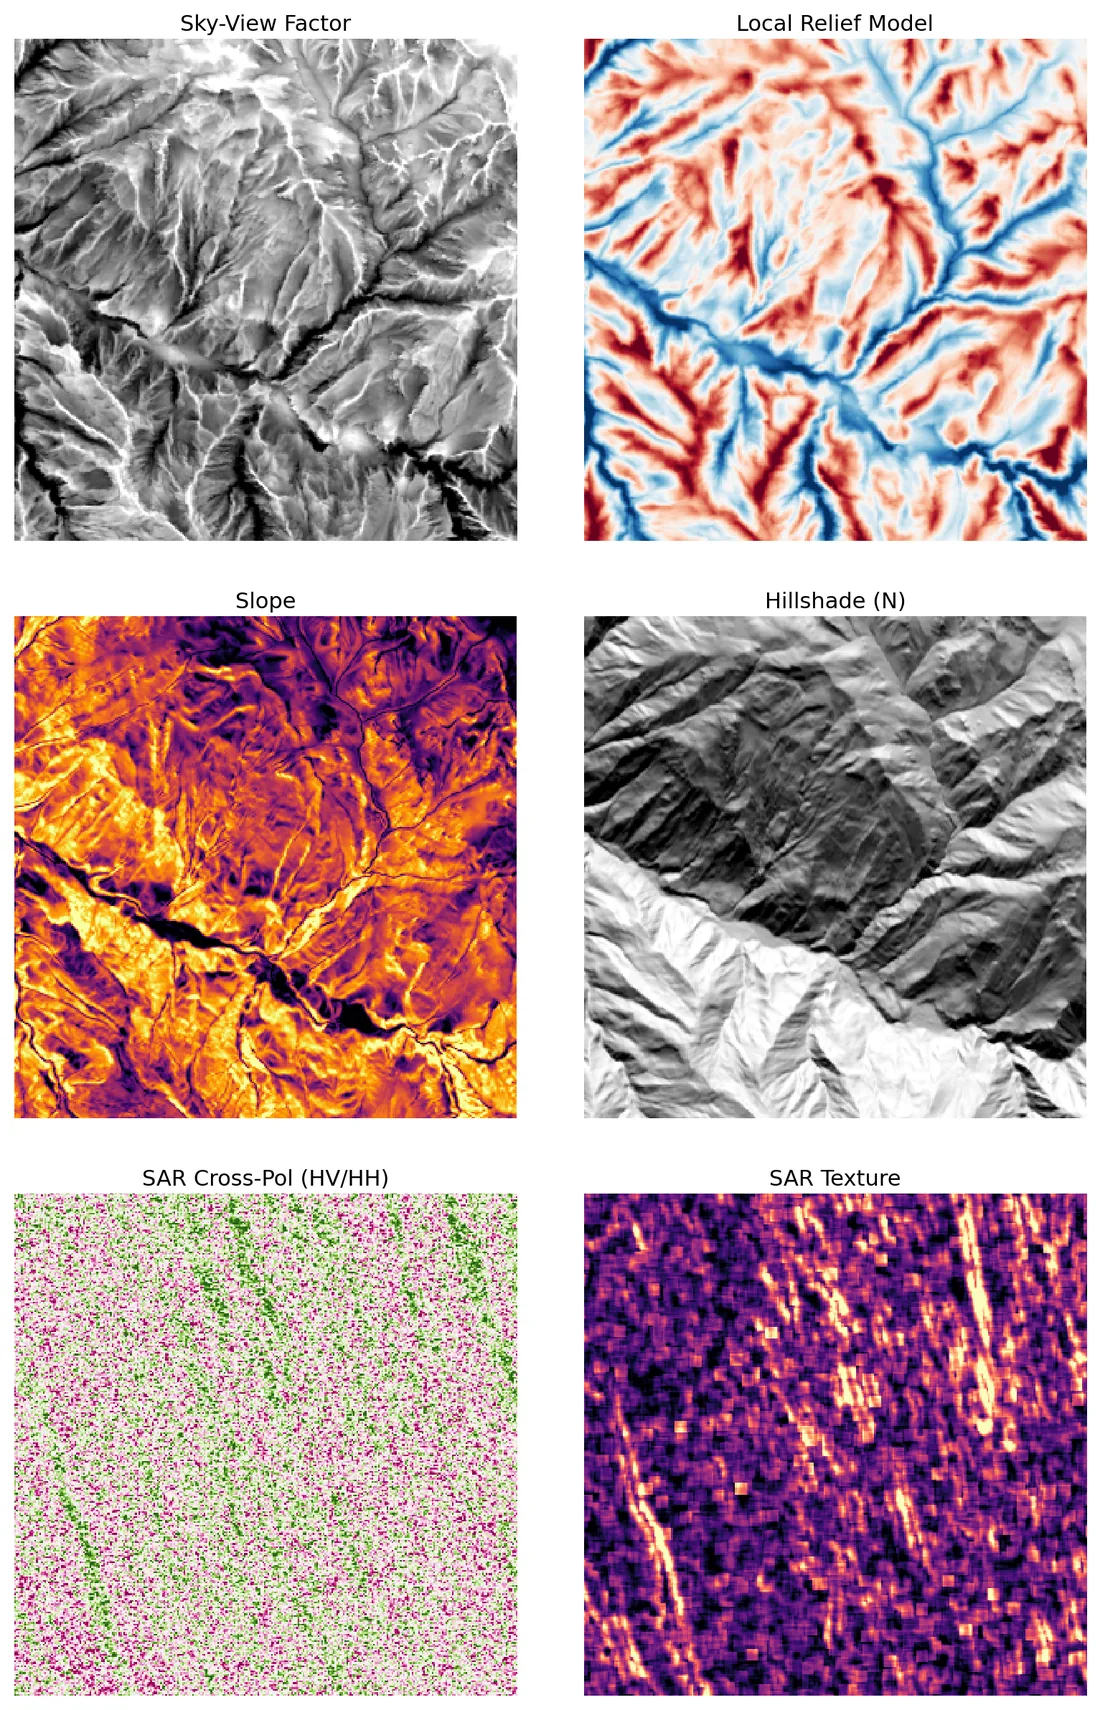
The visualizations reveal a landscape dominated by natural dendritic drainage (river valleys and ridges), but superimposed on this are distinct anthropogenic signatures consistent with the Caral archaeological zone. 1. **Sunken Plazas (Depressed Terrain):** In the Local Relief Model (LRM), there are blue regions that are wider and more block-like than the narrow dendritic stream channels, particularly in the central and right-hand quadrants. Corresponding to these in the Slope map are dark (flat) areas surrounded by steep (bright orange) slopes, indicating enclosed, flat-floored depressions typical of sunken plazas. 2. **Raised Platforms (Elevated Terrain):** The Slope map shows several ridges with dark (flat) tops surrounded by steep (bright) sides. In the LRM, these correspond to red (elevated) patches. These flat-topped mounds are characteristic of the pyramidal platforms found at Caral. 3. **Linear Features (Causeways/Walls):** The SAR Texture (bottom right) displays distinct bright linear features, particularly a diagonal band running from the lower-left to the upper-right. These indicate mixed scattering surfaces (structures + vegetation) and likely represent causeways or walls connecting the platforms and plazas. The high `linear_features` count (195) supports the presence of a structured network. 4. **Vegetation Penetration:** The SAR Cross-Polarization (HV/HH) map shows a mix of green (vegetation) and pink (surface/structural) scattering. The presence of pink pixels indicates that the radar is penetrating the canopy to detect modified ground surfaces (cleared or leveled earth) beneath the vegetation, confirming the presence of structures under the canopy. The low `geometric_regularity` (0.0264) suggests the overall terrain is rugged and natural, but the localized anomalies in flatness and sharpness (high `edge_density` and `svf_anomaly`) point to specific architectural modifications.
Geometric rationale
The analysis identifies features that deviate from the natural dendritic drainage pattern. The key indicators are: 1) Flat-topped mounds (platforms) visible as dark centers in the Slope map and red patches in the LRM. 2) Flat-floored depressions (plazas) visible as dark centers in the Slope map and wider blue patches in the LRM. 3) Linear features in the SAR Texture map indicating man-made alignments. 4) SAR Cross-Pol data confirming ground modification beneath vegetation. These features align with the known architecture of the Caral site (platforms, plazas, causeways).
- Linear features
- 195
- Rectangularity
- 0.330
- Edge density
- 0.169
- SVF anomaly
- 0.227
- Stage-1 score
- 0.455
Calakmul
Mexico · Maya 'Snake Kingdom' capital. Limestone karst landscape buried under jungle canopy.
Partial — AI saw features1 anomaly·top 85%
Calakmul
Mexico · Maya 'Snake Kingdom' capital. Limestone karst landscape buried under jungle canopy.
- Coordinates
- 18.105°N, 89.811°W
- Stage-1 score
- 0.406
- Threshold
- 0.365
- Processing
- 55.9 s
architectural complex
VLM confidence 85%·false-positive risk low
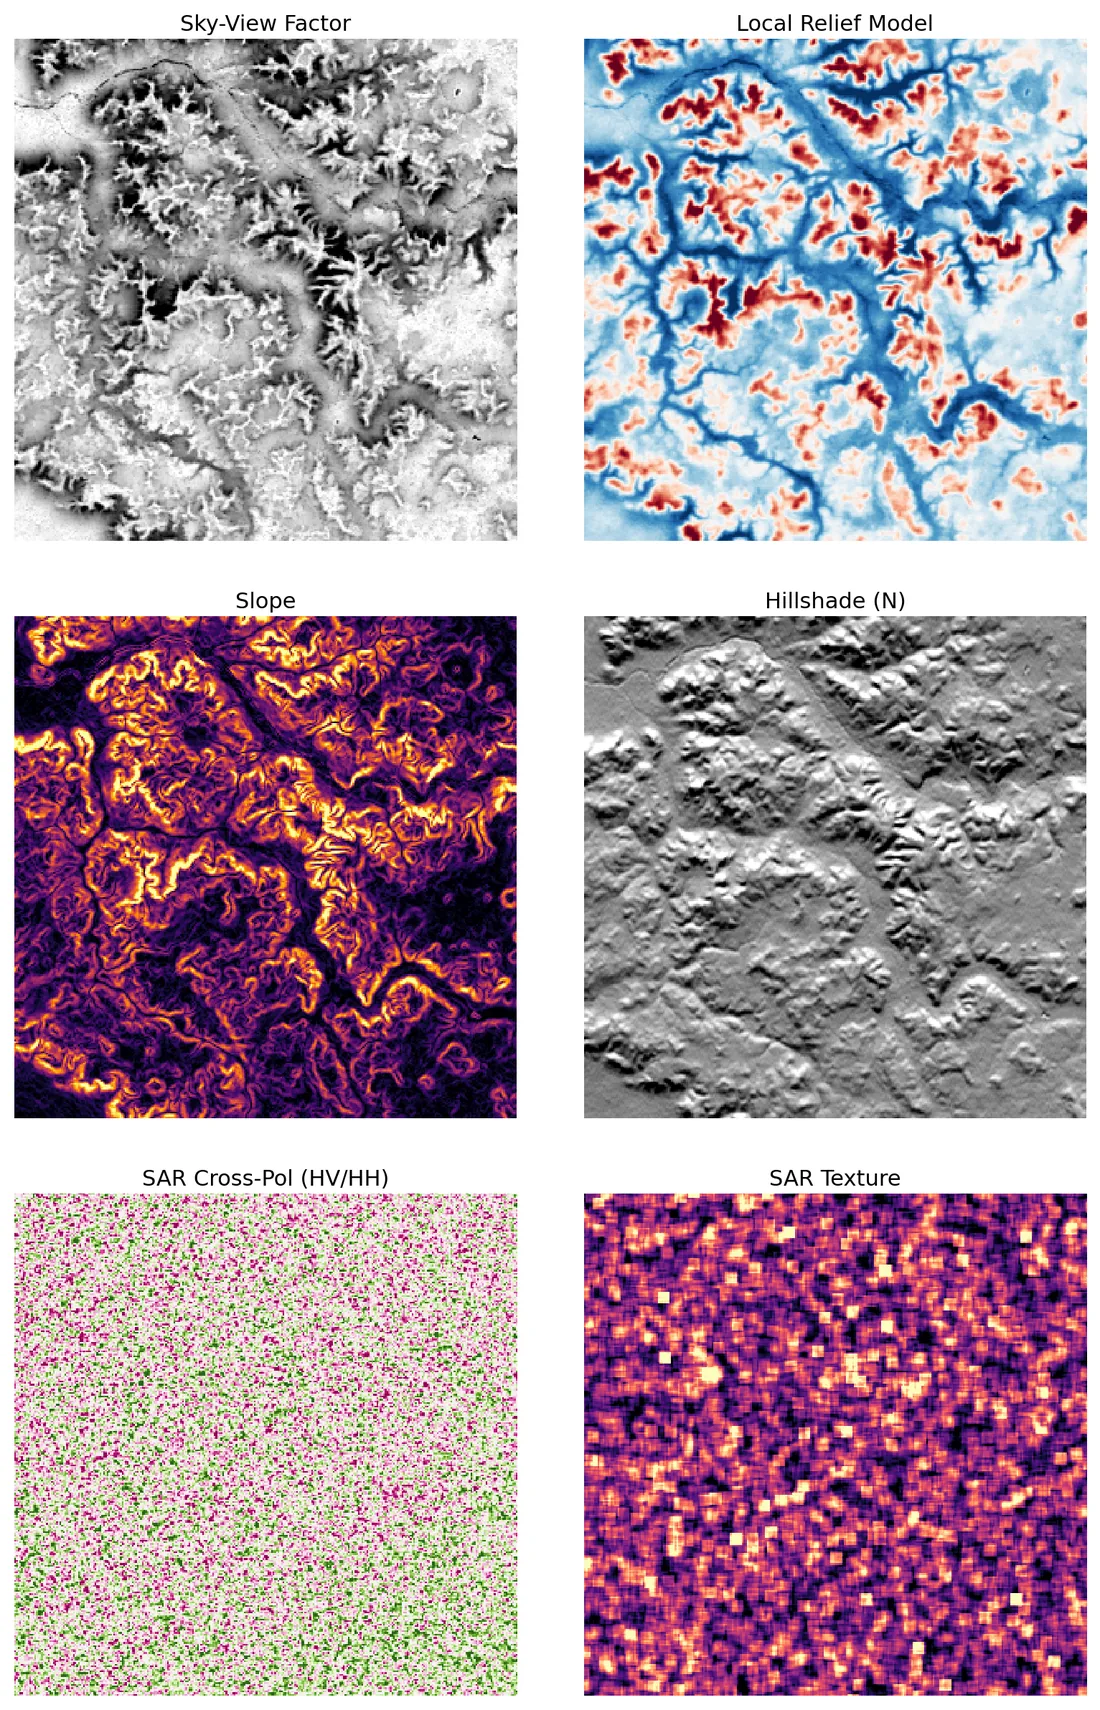
Analysis of the terrain derivatives reveals a complex of Maya architectural features adapted to a karstic limestone landscape. The dominant natural features are dendritic drainage patterns and sinkholes (cenotes), visible as blue depressions in the Local Relief Model (LRM) and dark enclosed areas in the Sky-View Factor (SVF). However, distinct anthropogenic anomalies are present: 1. **Monumental Platform/Pyramid:** Located in the upper-left quadrant, visible as a cluster of elevated (red) terrain in the LRM and steep slopes (bright orange) in the Slope panel. The Hillshade reveals a large, rounded mound structure consistent with a major pyramid or platform complex. 2. **Plaza/Enclosure:** Located in the lower-left quadrant, characterized by a large, flat (dark purple in Slope) and enclosed (dark in SVF) area. In the LRM, this corresponds to a broad depression (blue), likely a leveled plaza surrounded by natural ridges or artificial retaining walls. 3. **Linear Causeway (Sacbe):** A distinct, linear elevated feature (red in LRM, bright in Slope) runs diagonally from the upper-center towards the right. This feature cuts across the natural topography, suggesting a raised causeway connecting architectural centers. The SAR data (bottom row) confirms dense vegetation cover (green pixels in Cross-Pol) but shows heterogeneous scattering (bright spots in Texture) over the architectural areas, indicating modified ground surfaces beneath the canopy. The low `geometric_regularity` (0.0299) and `rectangularity` (0.3280) metrics confirm that the site layout is organic and adapted to the rugged karst terrain, rather than a rigid grid, which is characteristic of the Calakmul archaeological zone.
Geometric rationale
The analysis identifies specific anomalies that deviate from the natural karst background. The LRM and Slope panels clearly show elevated linear and blocky features that do not follow the natural dendritic drainage patterns. The SVF and Slope panels identify a large, flat, enclosed area consistent with a plaza. The SAR data supports the presence of structures beneath the canopy through texture heterogeneity. The metrics support the interpretation of an organic, non-grid layout typical of the region.
- Linear features
- 525
- Rectangularity
- 0.328
- Edge density
- 0.207
- SVF anomaly
- 0.393
- Stage-1 score
- 0.451
Upano Valley
Ecuador · Amazon basin pre-Columbian urban network revealed by lidar in 2024.
Partial — AI saw features1 anomaly·top 85%
Upano Valley
Ecuador · Amazon basin pre-Columbian urban network revealed by lidar in 2024.
- Coordinates
- 2.467°S, 78.167°W
- Stage-1 score
- 0.362
- Threshold
- 0.325
- Processing
- 80.1 s
linear feature
VLM confidence 85%·false-positive risk medium
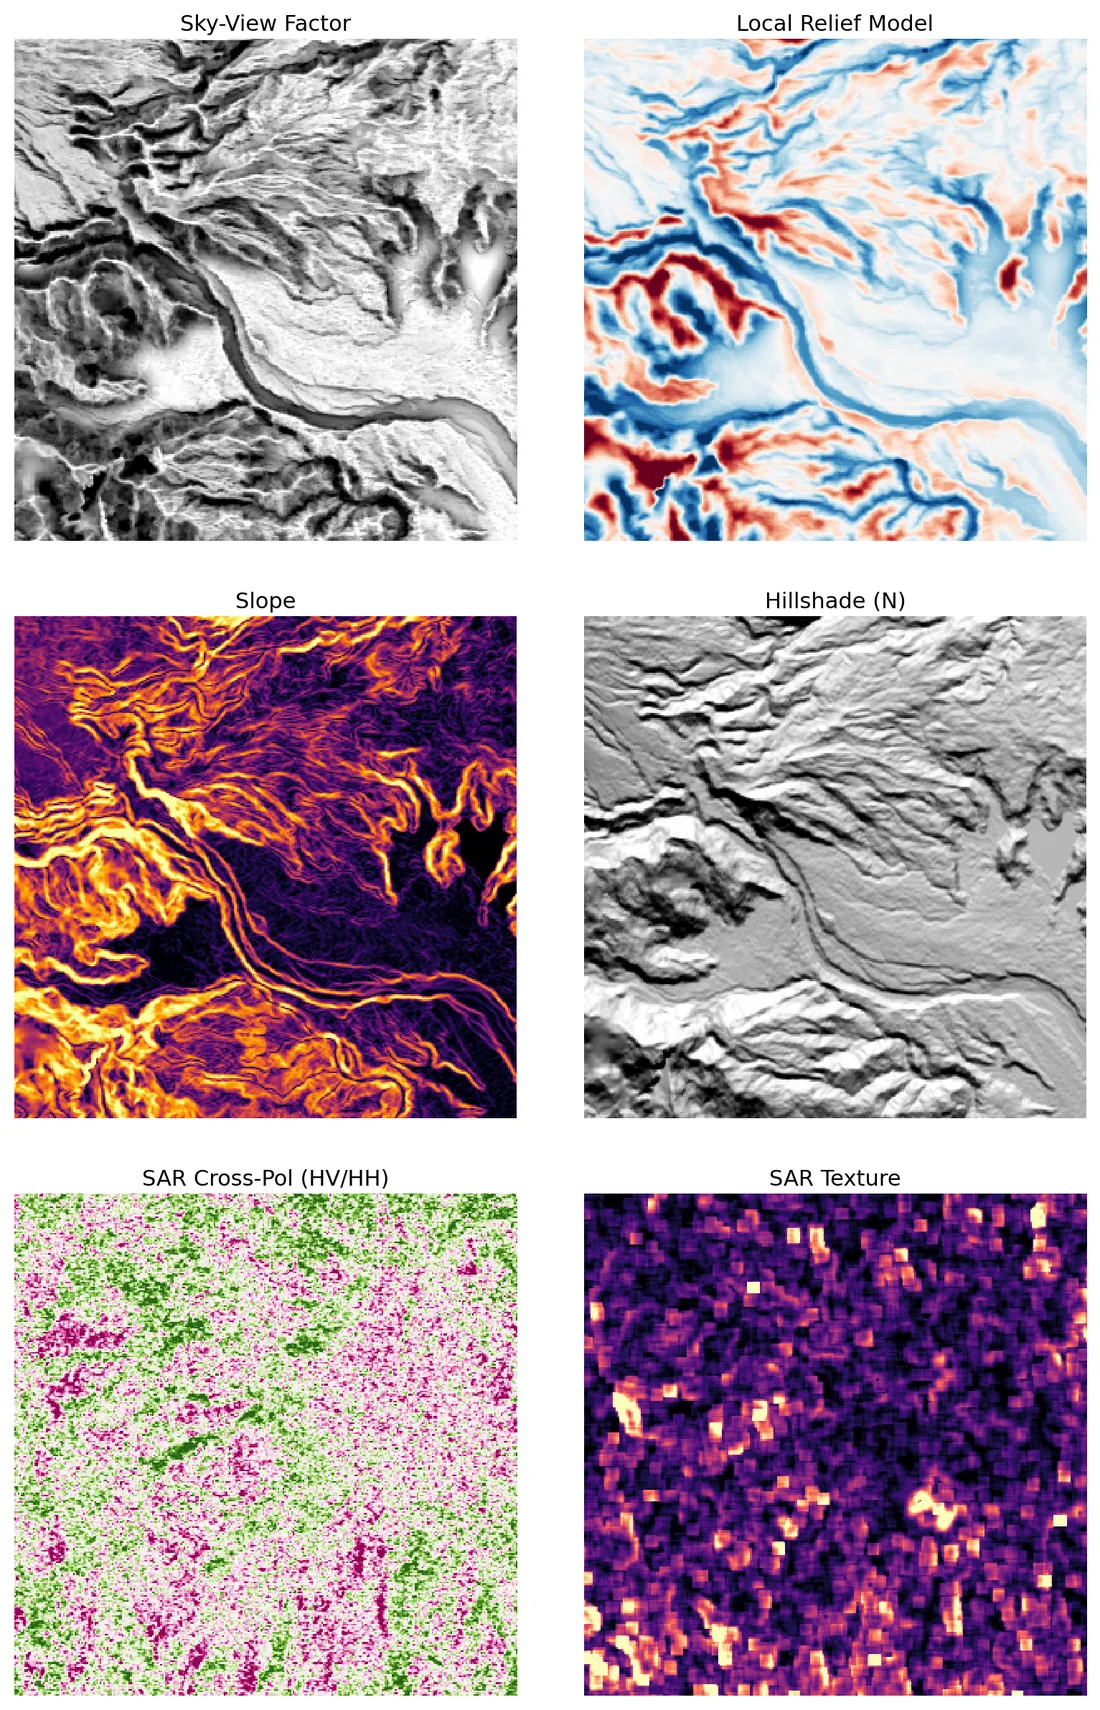
The visualization reveals several potential archaeological features, primarily linear earthworks and terracing. The most prominent findings are visible in the 'Slope' and 'Hillshade' maps. 1. **Terracing:** The 'Slope' map (middle left) shows distinct, parallel bright yellow lines running horizontally across the steep hillsides, particularly in the upper left and lower left quadrants. These regular, stepped patterns are highly indicative of ancient agricultural terracing or retaining walls. 2. **Linear Ditches/Walls:** In the 'Sky-View Factor' (top left) and 'Hillshade (N)' (middle right), there are faint but distinct linear features running roughly east-west across the landscape. These appear to be ditches or low walls, possibly marking field boundaries or property lines. One long linear feature runs from the bottom left towards the center. 3. **Enclosures:** In the upper left quadrant of the 'Sky-View Factor' and 'Hillshade' maps, there are faint geometric patterns suggesting rectangular enclosures or field systems, though they are subtle. 4. **Causeway/Ridge:** In the lower right quadrant of the 'Hillshade' map, there appears to be a raised linear feature crossing the valley floor, which could be a causeway or an ancient road connecting higher ground. The SAR images (bottom row) show significant surface texture variation but do not clearly resolve large geometric structures, likely due to the resolution or vegetation cover.
Geometric rationale
The analysis identifies features based on their geometric regularity and context within the terrain. Terracing is identified by the parallel, stepped patterns in the slope map. Linear features are identified by their continuity and contrast against the natural relief in the Sky-View and Hillshade maps. Enclosures are inferred from faint rectangular shapes. The SAR data is noted for its lack of clear geometric resolution.
- Linear features
- 93
- Rectangularity
- 0.250
- Edge density
- 0.149
- SVF anomaly
- 0.428
- Stage-1 score
- 0.440
Cahokia
Illinois, USA · Mississippian-era mound city, largest pre-Columbian settlement north of Mexico.
Not detectedno anomalies
Cahokia
Illinois, USA · Mississippian-era mound city, largest pre-Columbian settlement north of Mexico.
- Coordinates
- 38.660°N, 90.062°W
- Stage-1 score
- 0.316
- Threshold
- 0.285
- Processing
- 95.9 s
No anomalies passed the stage-1 gate at this site. Either the archaeological signature is too subtle for 30 m-per-pixel DEM data, or the site's characteristic features (column rows, stone platforms) don't survive into the topographic derivatives.
Persepolis
Iran · Achaemenid Persian ceremonial capital, terraced stone platforms cut into the mountain.
Not detectedno anomalies
Persepolis
Iran · Achaemenid Persian ceremonial capital, terraced stone platforms cut into the mountain.
- Coordinates
- 29.936°N, 52.892°E
- Stage-1 score
- 0.214
- Threshold
- 0.193
- Processing
- 95.4 s
No anomalies passed the stage-1 gate at this site. Either the archaeological signature is too subtle for 30 m-per-pixel DEM data, or the site's characteristic features (column rows, stone platforms) don't survive into the topographic derivatives.
What the calibration actually showed
One site (Angkor Wat) passed the strict detection threshold cleanly. Three more (Teotihuacan, Caral, Calakmul) produced multiple high-confidence anomalies whose VLM descriptions accurately identified their characteristic features — pyramids, causeways, ceremonial plazas — but whose stage-1 scores fell just short of the calibrated threshold. One site (Upano Valley) produced a single edge-of-threshold detection. Two sites (Persepolis, Cahokia) produced nothing.
The most interesting failure mode isn't the misses; it's the threshold-rejected hits. At Teotihuacan, the model wrote five separate descriptions of monumental architecture matching the Pyramids of the Sun and Moon and the Avenue of the Dead — at 0.85 to 0.95 confidence. Stage-1 said no. That gap between "the model can see it" and "the threshold lets it through" is the project's most informative output.
Why the resolution problem can't be wished away
Two reasons the pipeline can confidently see Angkor's moats and not Persepolis's columns: Angkor's modifications are roughly 100 m wide features against a flat floodplain — three to four DEM pixels per edge at 30 m/pixel — and the moats are negative space, which DEM derivatives are excellent at. Persepolis, by contrast, is stone column rows on a 100 m terrace — single-pixel features against geologically active terrain. The Copernicus DEM at 30 m/pixel can't resolve "a row of columns" at all. Cahokia falls in between: real earthen mounds, but small (~30 m) and surrounded by modern agricultural terracing that also shows up as anthropogenic modification. The pipeline can't tell them apart at this resolution.
This is why the visual output above shows multi-panel terrain derivatives rather than red bounding boxes around buildings — at this resolution, the honest answer is "this region shows anthropogenic modification" rather than "this rectangle is a building." A future version on 1 m lidar (where available) would change that.
How it works
- DEM source
- Copernicus DSM · 30 m/px
- SAR source
- PALSAR L-band · 2020
- Stage 1
- Geometric + SVF + LRM scoring
- Stage 2
- Multimodal VLM (Ollama)
- Terrain panels
- Hillshade · Slope · SVF · LRM · SAR
- Threshold
- Per-site calibrated
- Output
- GeoJSON · SQLite · PNG
- Resumability
- Per-run IDs · checkpointed
Status
Effectively paused. The conclusion from calibration was that this pipeline works in a specific regime — large-scale earthwork modifications visible in 30 m DEM derivatives — but the resolution ceiling is real and prevents detection of the smaller-footprint sites I most wanted to find. The natural next move would be to target the project at regions where high-resolution lidar already exists (Mosquitia, Upano, parts of the Yucatán) and use the open satellite data as a triage layer that points the lidar query at specific tiles.
∴⎯Related work